Commercial real estate, on a real operating layer.
A commercial real estate firm brought us in to take the business off PDF reports and email threads. Deal pipeline, asset performance, investor reporting, and capital tracking, on one connected system the whole firm can trust.

Sixty-plus assets. Twelve spreadsheets per asset.
The portfolio had outgrown its system. Asset managers tracked performance in property-management software, finance rolled it up in Excel, the reporting team rebuilt investor packs in PowerPoint, and the deal team ran new acquisitions out of email.
Every quarter the rollup took the same two weeks. Every investor question took the same hour of detective work. They came to us to build the operating layer the firm had earned, so the team could spend more time on deals and asset value, less on reconciliation.
We started with one quarter-end. And one asset.
Most platforms try to do everything at once. We did the opposite: we picked one asset and one investor report, mapped every input, every transform, every output, and proved we could deliver it end-to-end in the new system without anyone touching a spreadsheet.
From there, scaling out to the full portfolio became a question of repetition, not invention.
Map + prove on one asset
- Asset, deal, finance, reporting workflow mapping
- Investor report dependency tracing
- Capital and waterfall calculation audit
- End-to-end single-asset prototype
Build, roll out, scale
- Unified asset + deal pipeline
- Capital tracking and waterfall engine
- Investor report auto-generation
- Portfolio-wide rollout, asset by asset
One layer. From deal screen to investor report.
The platform reads from where the data already lives, runs the rules the team already follows, and writes the result somewhere everyone, including investors, can verify.
A deal pipeline that doesn't live in inboxes.
Every deal moves through the same stages: screen, LOI, due diligence, close. Each stage has its checklist, its owner, and the financial model attached. IC sees the same view every Monday, and the deal team sees what's stuck before the meeting.
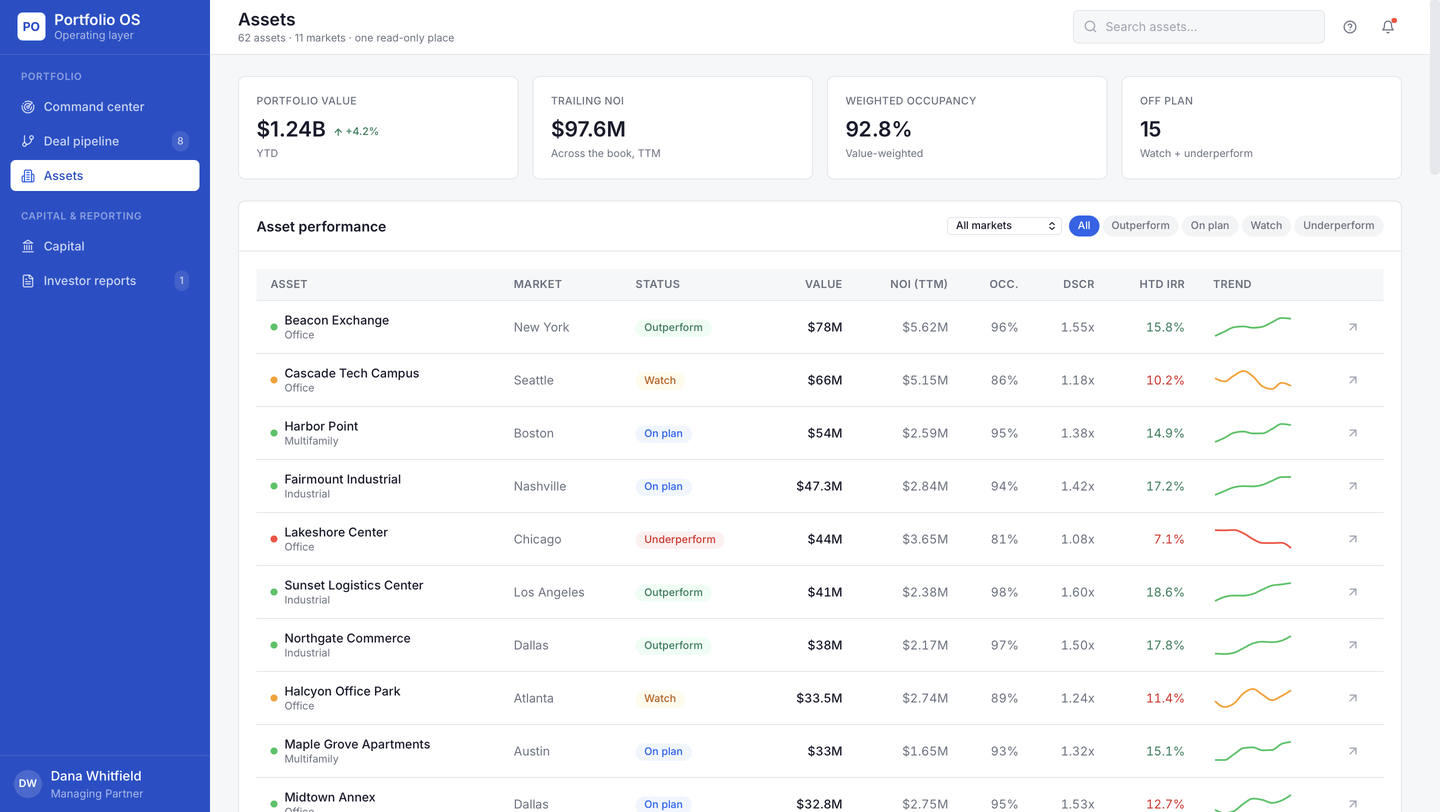
Asset performance, in one read-only place.
NOI, occupancy, debt service, cap rate, hold-to-date returns. All pulled from the source systems, all normalized, all on one page per asset. Asset managers stopped maintaining their own decks. Finance stopped chasing them down.
Investor reports the team doesn't have to assemble.
Quarterly packs render straight from the operating layer. Every chart, every table, every footnote traces back to the source data. The team reviews, narrates, and sends. The two-week quarterly rollup is over.
From PDFs and panic to real portfolio software.
One operating layer. Every asset. Every dollar. The deal team works from the same view as the reporting team. Investors get the data they ask for, with the lineage that proves it.
Of every asset and every deal in the pipeline.
Replacing 60+ standalone files.
From quarter close to investor report out the door.
Quarterly rollup is now part of the platform.
In avoided hiring as the book grew.
Same team handling more assets, more deals.
Investor-ready data, on demand, with lineage.
Every number traces back to its source.